These are some resulting figures from my code.
Erebus
From the code you see on the code page: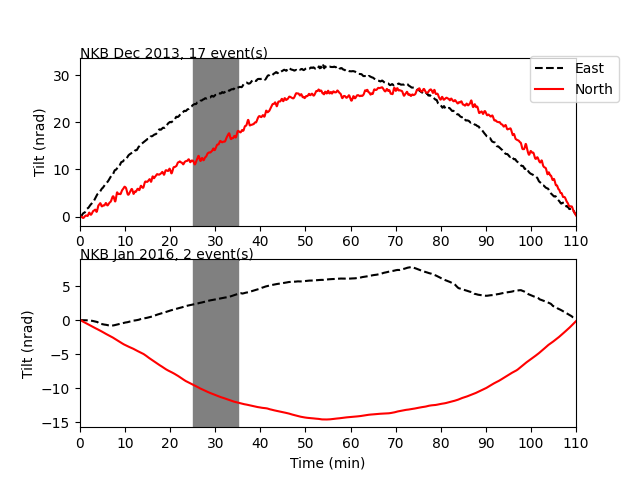
Obviously, with more events in a stack, the better image you'll get. Handpicking data is a little time consuming, but helps create clearer images by manually getting rid of some noise.
Right now there isn't a clear signal in this image other than what is probably natural drift. Hopefully with more events and looking at other stations we can see a tilt signal before an eruption.
Fuego
From the Lyons 2012 paper, I tried to recreate Figure 2.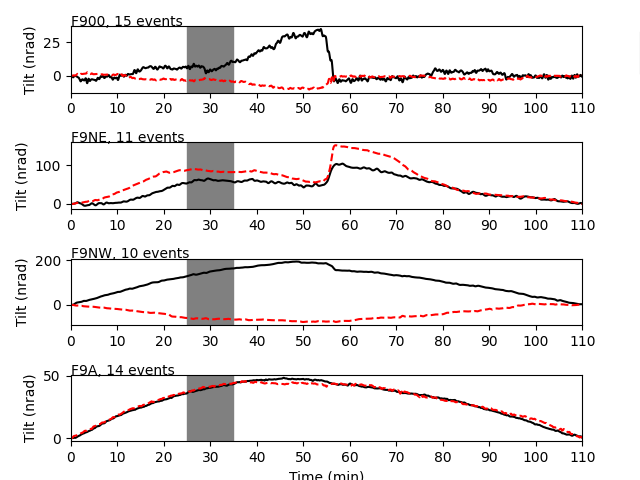
IF you compare this to the figure from the paper, you can see that the plot I got for station F9NE was pretty close, but the others are off in one way or another. Part of it is likely a problem in my code, likely within the filtering. I know some of the problems will arise in the events that I picked to use.
Santiaguito
Santiaguito has a station that has both a seismometer and a tiltmeter, as well as generally cleaner data than Fuego.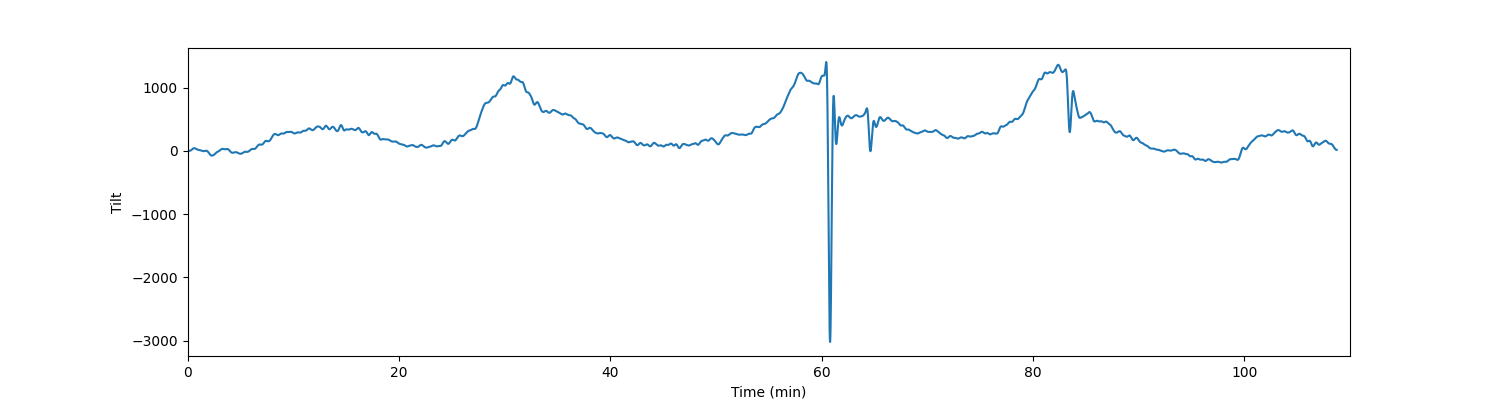
This is tilt calculated from my code at just one channel at one time from Santiaguito. It is very close in shape to the tilt measured, though the large peaks detract from that. This data came from the north channel on station SJON.